Blogs
Check out the latest topics & trends
Understanding the cost implications is crucial when planning for a website in Dubai. The investment varies based on the type of website you need. Here's a simplified table to give you a clearer idea of what to expect in terms of pricing, features, and timelines for website design costs in Dubai

In today's digital world, especially in a dynamic city like Dubai, having a standout website is more than just a plus – it's essential. Every day, a myriad of businesses are competing for the spotlight in the vibrant online marketplace.
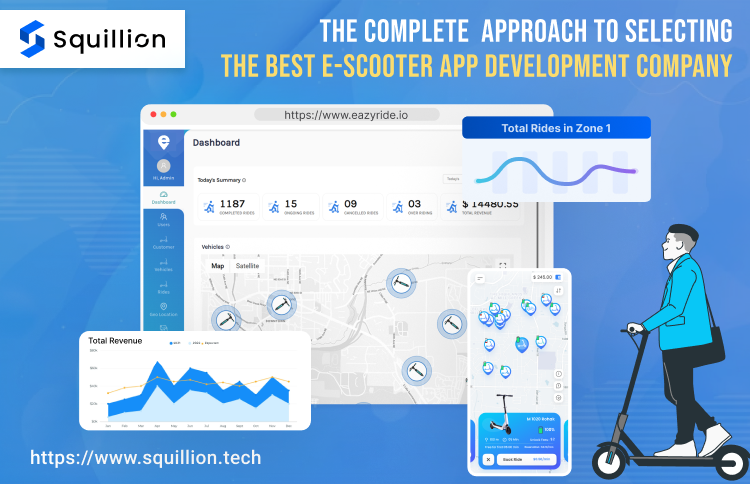
So, you're all set to dive into the e-scooter app pool. But hold up – what's everyone looking for in an e-scooter app these days? Let's break it down and see what's cooking in the industry.

Did you know that the success of your software development project can hinge on a single decision? That's right, the methodology you choose can be a game-changer.
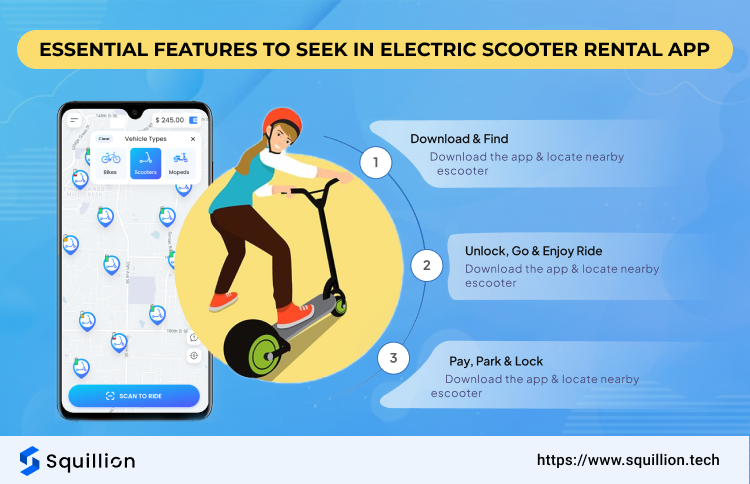
An electric scooter rental app is your key to navigating the urban landscape with ease and efficiency. It's a platform where users can quickly find, book, and pay for electric scooters, making short city trips more convenient than ever.
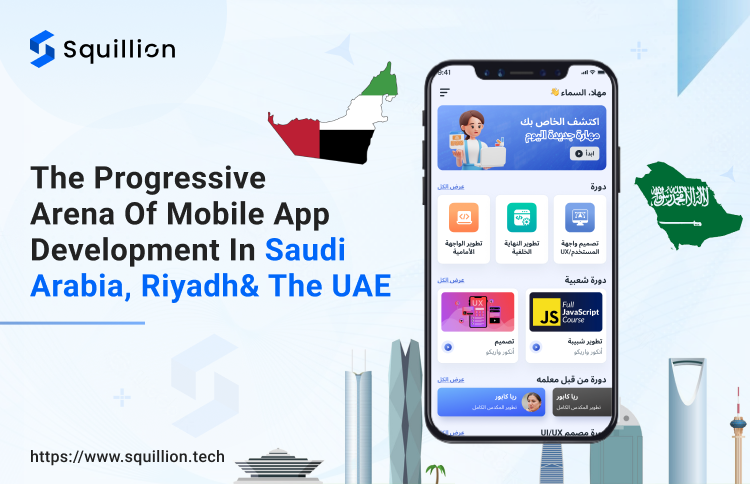
Did you know that in the world of mobile app development in Saudi Arabia, the total revenue is expected to skyrocket with an annual growth rate (CAGR 2022-2027) of 10.76%, hitting a projected market volume of US$2,480.00m by 2027?

In today's fast-paced world, the way we shop for groceries is undergoing a monumental shift. With the rise of grocery delivery apps, consumers prioritize convenience and efficiency more than ever.
Imagine a world where billions of devices, from your smart refrigerator to city-wide traffic systems, are chatting away. Now, imagine the chaos if they all spoke different languages. Enter MQTT - the universal translator for the Internet of Things (IoT).

