Data Visualization Consulting Services

Untangle your data through data visualization solutions. You can make data-driven decisions! Make better decisions faster with beautiful, intuitively interactive dashboards that provide your teams with the data they need with data visualization services from Squillion.

Take advantage of your data and analytics through data visualization consulting with the help of an excellent data visualization company like Squillion to make informed decisions.

DATA VISUALISATION
bg-doat

Visualize Data To Gain Valuable Insights​

Organizations gather data about customers, services, and systems from more sources than ever before and can leverage this information to accelerate innovation, growth, and strategic advantage.

The ability to visualize data sets in a pictorial format helps businesses identify trends and see concepts more clearly. Through the use of visuals, trends can be identified, and concepts can be visualized more easily. 

Your message can be tailored to your customer’s needs and the context in real time based on their previous interactions with you. It’s possible. You don’t need speed-reading skills to sort through an extensive data library.

Make your customers happy by making your data more intuitive and simple to understand. Here are some ways to make your customers happier using data visualization.

We provide customized solutions and KPIs for measuring the growth of your business with Squillion’s pixel-perfect reports and interactive dashboards. Our automated reporting eliminates manual data entry and provides pixel-perfect reports and interactive dashboards tailored to your business needs.

Our dashboards enable you to effectively communicate your data, make it actionable, and engage other stakeholders by transforming it into an interactive, easy-to-read format.

The solutions provided by Squillion help organizations collect, clean, and process data, reducing the complexities and errors associated with manual data processing.

The automated systems will create reports that will provide you with insight and simplify the data handling process. By analyzing these reports, you will be able to make better decisions.

Trusted by well-known Clients

line-rectangle
leftsite image
M4M-logoM4M-logo
city-bike-logocity-bike-logo
softcare-logosoftcare-logo
egss-logoegss-logo
pickborad-logopickborad-logo

Squillion Data Visualization
Services

Our data visualization company provides solutions such as:

  • A consistent experience for data analysts.
  • Consumers of information.
  • People without a business intelligence background.

There is no doubt that the performance of high-tech products can be enhanced by their own analytics, which includes the spotting of trends, the recognition of patterns, the monitoring of results, and the tracking of essential metrics.

Data analytics platforms can be created from scratch, intelligent dashboards can be added to your software products, or you can create your own data analytics platform.

It doesn’t matter whether it’s a responsive UI or a complex functional module that you need. Every element of your platform will be delivered on time and to the highest standard.

Our offerings in Data Visualization include the following:

Data Storytelling

Collaborating, visualizing, and making decisions are easier when effective tools are used to collect information and create narratives and visuals.

Customized Dashboard Development

Visualizing data allows you to gain a better understanding of your data. It is a useful tool for improving data analytics and business intelligence.

Dashboard And Reports Development

Dashboard work for all. Our solutions are available for users at all levels, from CEOs to data analysts to those without experience in data visualization.

Data Visualization Strategy and Implementation

Modernizing your Data Platform makes better decisions through better data collection, design, development, and deployment possible.

How does Data Visualization help your business succeed?

Filtration

Deep-Dived Data Filtration

The use of filters enables organizations to identify which channels are performing well and which are not by creating filtered dashboards.

Un-Complexing

Un-complexing the Data

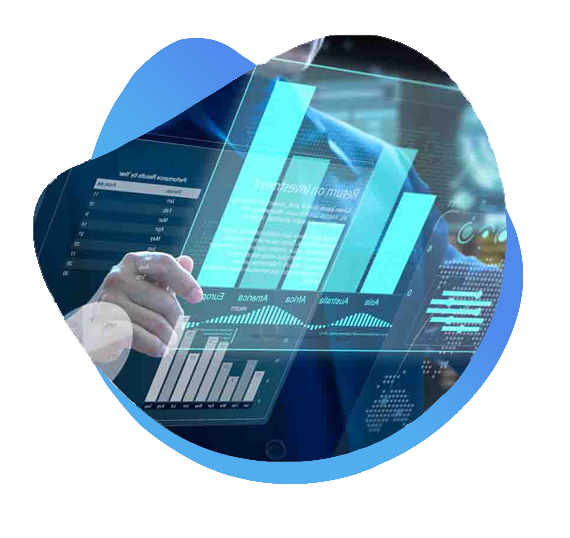
We provide our clients with a wide range of data visualization services, including interactive dashboards, charts, tables, and maps.

Customized_Reports

Intuitive Customized Reports

CEOs, for example, need KPIs from all departments, whereas managers only need to know how their teams are doing.

Data_Driven

Data-Driven Reporting

Access to essential data and insights allows all decision-makers to become more data-driven without being dependent on others.

Data visualization process

Our research and development strategy aims to determine the best method for answering your questions and achieving your vision to assist you throughout your data journey. We analyze your data sources, facts, figures, and engineering solutions to provide you with predictive insights.

Collect Data

The first step in data visualization is to gather data from different departments and combine them all.

Clean Data

The IBM report states that incorrect data costs U.S. companies heavily, so it is imperative to clean data before visualization.

Choose A Chart Type

Charts are plentiful, but before choosing one, it is important to have insights, data, comparisons, and relationships.

Prepare Data

Prior to combining variables, creating aggregate values for groups, and creating new columns, a chart must be finalized.

Visualize Data

In the final stage, we will implement the data visualization solutions and represent them in the graphs with insights.

Visualization of data-driven business
outcomes and decision-making

Our data visualization company identifies quality issues and improves the datasets for intelligent real-time decision-making through top-notch data visualization consulting services.

enterprise-technology
Enterprise Technology
banking-and-finance-sector
Banking and Finance Sector
healthcare
Healthcare
education
Education
transportation
Transportation
retail
Retail
media
Media
insurance
Insurance
manufacturing-icon
Manufacturing
consumer-technology
Consumer Technology
oil-and-gas
Oil and Gas
travel
Travel

Why choose Squillion for
data visualization services?

Experts with battle-hardened skills

All members of your organization can contribute to improving, honing, and innovating the whole data journey within your organization.

Techniques for displaying data

Utilize data visualization to its fullest potential. Our team is experienced in implementing interactive dashboards.

Data Visualization

Reduced costs and time

Drive critical business decisions with data by automating complex data management and data analytics efforts.

Expertise in data analytics

Take advantage of advanced analytics and insights to transform your organization into a data-driven organization.

Technology Stack

line-rectangle
  • Angular
  • React
  • Vue js
  • CSS
  • js
  • Bootstrap
  • html
  • d3
  • jQuery
  • Node.js
  • Python
  • PHP
  • Laravel
  • Android
  • iOS
  • React Native
  • Flutter
  • Ionic
  • Mysql
  • SQL Server
  • MongoDB
  • Firebase
  • WordPress
  • Shopify
  • Magento
  • Figma
  • Adobe XD
  • Photoshop
  • Sketch
  • Illustrator
  • Power BI
  • D3.js
  •  Tableau
  • AWS
  • Google cloud
  • Azure
  • Heroku

Recognized Leader In Tech Innovation​

FAQs for the Data Visualization

How do data visualization services help in decision-making?

The use of data visualization enables employees to analyze large volumes of data in a timely and efficient manner by providing them with a visual representation of the data, which makes it easier for them to interpret.


What are some common data visualization tools and techniques?

Google Charts, Tableau, Grafana, Chartist, FusionCharts, Datawrapper, Infogram, ChartBlocks, and D3. Js are among the best data visualization tools. In addition to Pie and Donut Charts, Histograms, Scatter Plots, Kernel Density Estimation for Non-Parametric Data, Box and Whisker plots, Word Clouds, Network Diagrams, and Correlation Matrixes are used to visualize data.