Welcome to the Finance Portfolio! This document outlines the critical financial metrics and insights derived using advanced analytics tools. Our comprehensive Financial Dashboard is designed to facilitate strategic decision-making and optimize financial performance.
The Finance Dashboard is a dynamic reporting solution designed to provide real-time financial insights into key business metrics. It integrates multiple financial components, including revenue, expenses, profitability, assets, liabilities, receivables, and payables, to deliver a holistic view of the organization’s financial health.
Key Features
Comprehensive Financial Snapshot
View key metrics like profit margins, growth trends, and cost efficiency all in one interactive dashboard.
Centralized Financial Reporting
Combine multiple data sources such as ERP, accounting software, and Excel, into one unified view.
Professional-Grade Visualizations
Present your financial performance using dynamic Power BI charts, KPIs, and interactive graphs.
Real-Time Financial Visibility
Monitor your revenue, expenses, and profitability with live, up-to-date dashboards.
Data-Driven Decision Making
Empower stakeholders with clear visual reports that simplify complex finance metrics.
User-Friendly Interface
Built with simplicity in mind—designed for finance professionals, not just data experts.
Tackling Challenges with Financial Insights
Challenge
Variability in revenue can hinder operational continuity.
Rising costs require constant monitoring to maintain profitability.
Lack of transparency in financial data can lead to misinformed decision-making and poor resource allocation
Our Solution
Enables stakeholders to monitor financial performance and adjust strategies accordingly.
Empowers finance teams to make informed decisions based on comprehensive analytics.
Facilitates effective budgeting and forecasting aligned with organizational goals.
Dashboard Pages & Navigation
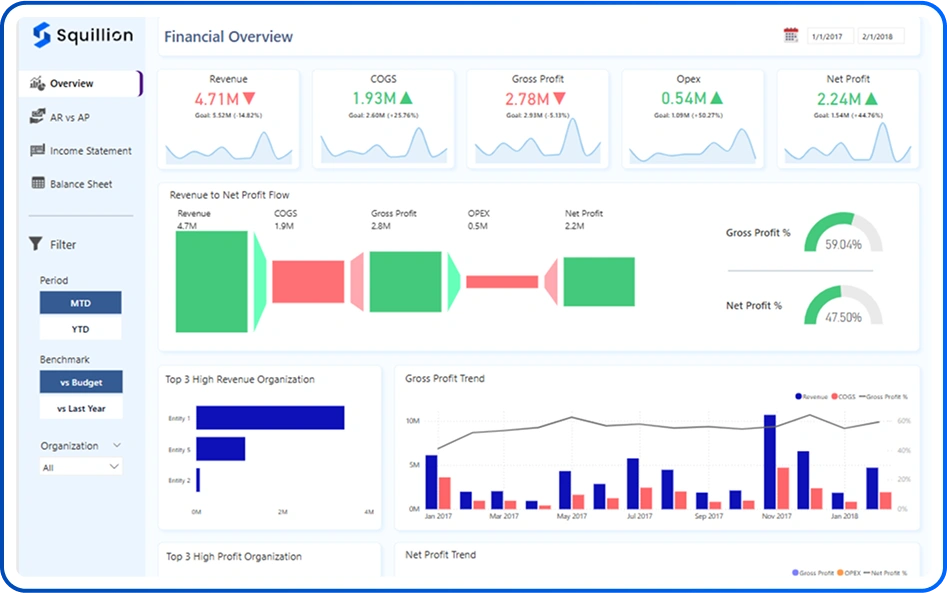
Finance Overview Page
Gain a real-time snapshot of your company’s financial health with key performance indicators like profitability, efficiency ratios, and revenue trends. This Power BI Finance Dashboard page empowers leadership to make data-driven strategic decisions.
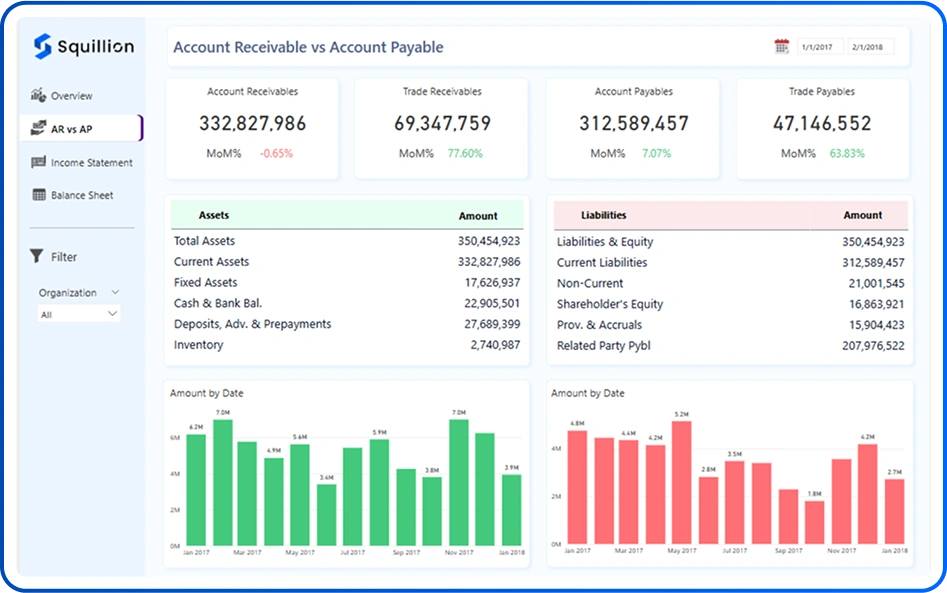
AR vs AP Page
Easily compare receivables and payables using interactive visuals to manage cash flow efficiently. Track inflows vs. outflows and identify potential liquidity issues before they impact operations.
AR vs AP Page
Easily compare receivables and payables using interactive visuals to manage cash flow efficiently. Track inflows vs. outflows and identify potential liquidity issues before they impact operations.
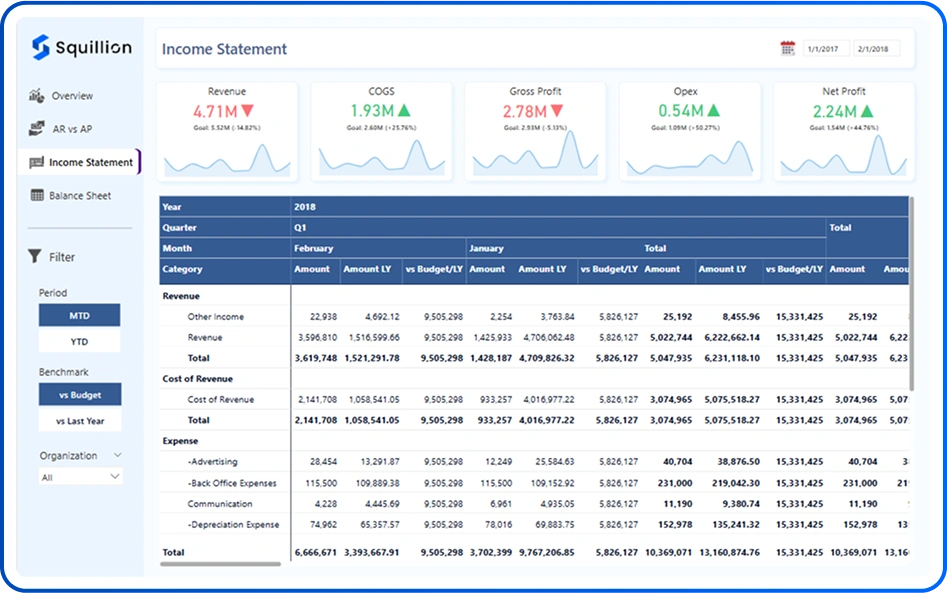
Income Statement Page
Monitor your financial performance with a dynamic breakdown of revenue, operating costs, gross margins, and net income. This page provides a comprehensive profit and loss (P&L) view that updates in real-time through Power BI.
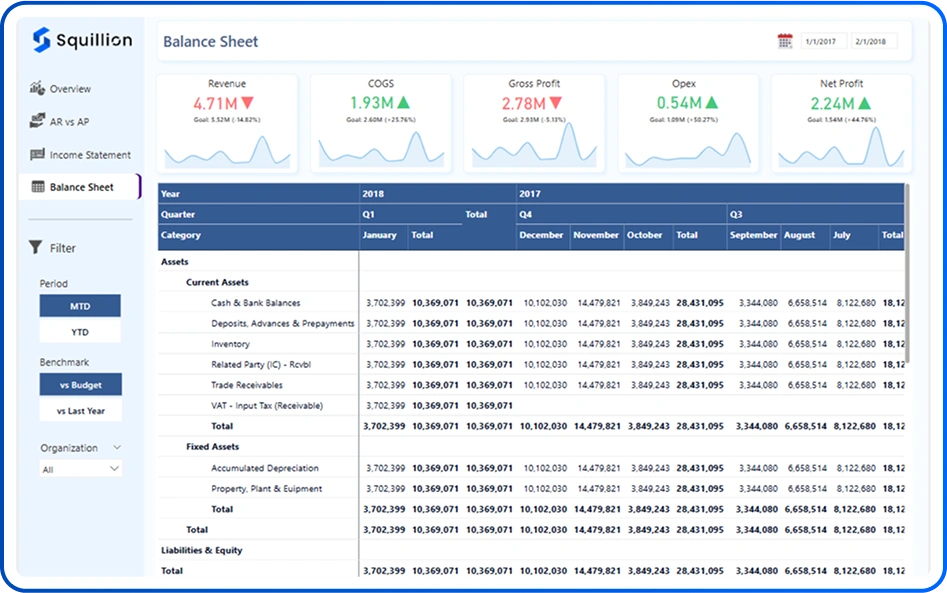
Balance Sheet Page
Understand your organization’s financial standing by analyzing assets, liabilities, and equity. This interactive balance sheet view supports better investment and funding decisions by showcasing short-term and long-term financial health.
Balance Sheet Page
Understand your organization’s financial standing by analyzing assets, liabilities, and equity. This interactive balance sheet view supports better investment and funding decisions by showcasing short-term and long-term financial health.
Key Insights
Uncover Spending Inefficiencies
Instantly spot where your company is overspending or underutilizing budgets.
Understand Profit Drivers
Discover which products, services, or departments generate the most value.
Improve Financial Planning
Use historical and current data to create smarter forecasts and allocate resources more efficiently.
Measure Business Growth Accurately
Monitor financial trends and align performance with strategic business goals.
Increase Transparency Across Teams
Share clear and consistent financial information with executives, managers, and stakeholders in real time.
Year-over-Year Growth
Compare key financial indicators across periods for clear growth and performance tracking.
FAQs
What is a Financial Performance Dashboard?
It’s an interactive tool that visualizes key financial metrics—such as revenue, profit, expenses, and cash flow—helping you monitor the financial health of your business in real time.
What kind of data does the dashboard show?
The dashboard includes data on revenue, profit margins, expenses, budgets vs actuals, financial ratios, trends, and more.
Who should use this dashboard?
Finance teams, CFOs, business owners, and decision-makers who want a clear view of financial performance at a glance.
Is the dashboard updated in real time?
Yes, it can connect to live data sources, ensuring you always see the most up-to-date financial information.
Can I customize the dashboard for my company’s needs?
Absolutely. You can tailor it to show specific KPIs, time periods, business units, or any financial metric relevant to your organization.
Can I drill down into specific data points?
Yes, you can click into metrics to see more detailed breakdowns—by department, product, region, or timeframe.
Does it integrate with our existing accounting or ERP systems
Yes, the dashboard supports integration with systems like SAP, QuickBooks, Dynamics 365, Oracle, Excel, and more.
Is it secure to view and share financial data?
Yes, access is controlled with secure permissions, and data is encrypted to keep your financials safe.
Do I need technical knowledge to use it?
No. The dashboard is designed to be intuitive and user-friendly, even for non-technical users.
How can I start using the Financial Performance Dashboard?
Just contact our team for a demo or to request a custom dashboard based on your financial reporting needs.