Map By Squillion
Elevate your data storytelling with engaging maps that highlight key insights!
Â
Transforming Data Visualization into an Unforgettable Journey with Map by Squillion! Unlock the full potential of your data visualization experience with our cutting-edge map visual. Crafted to elevate your reports and captivate your audience, Map by Squillion seamlessly integrates into your workflow, offering dynamic insights and immersive functionality.

Trusted by well-known Clients


Avg. Monthly Downloads
0
+
License Users
0
+
Top Rank by Popularity
0
Features List

Compare Columns
Compare up to two fields directly on your map to highlight regional differences or similarities. Spotlight insights and trends with ease, empowering informed decision-making.
Compare Columns
Compare up to two fields directly on your map to highlight regional differences or similarities. Spotlight insights and trends with ease, empowering informed decision-making.
Bubble Visualization
Visualize numerical values with bubbles on your map. Assign values to determine bubble size and customize appearance for visual impact. Gain deeper insights into data trends and patterns briefly.Location Marker
Pinpoint specific locations on your map with markers using latitude and longitude coordinates. Assign values to markers for additional data visualization. Upgrade to Premium and access custom markers or choose from our selection of default free markers. You can add categories to your location markers and add visual clarity. With the latest addition of zoom functionality, you can now add clustering to the markers.
Location Marker
Pinpoint specific locations on your map with markers using latitude and longitude coordinates. Assign values to markers for additional data visualization. Upgrade to Premium and access custom markers or choose from our selection of default free markers. You can add categories to your location markers and add visual clarity. With the latest addition of zoom functionality, you can now add clustering to the markers.
Engaging Interactions
Experience an immersive 3D-like hovering functionality that adds depth to your map visual. As you hover over data points, the visual comes to life, providing a captivating and interactive experience for users. Coupled with the latest zoom interactive experience, this feature ensures seamless navigation and precise focus.Video demonstration

Why Choose Map by Squillion?

Microsoft Power BI Certified
Rest assured, Map by Squillion meets the highest standards of quality, compatibility, and performance.
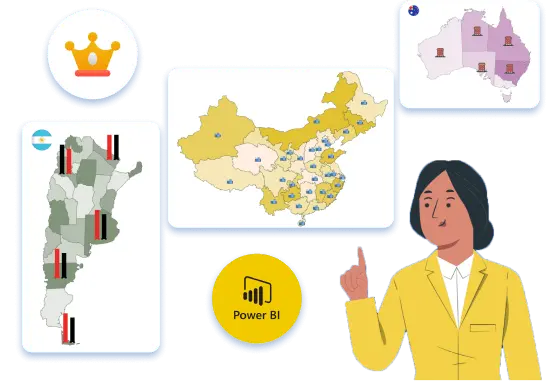
Engaging Visual Storytelling
Elevate your data presentation with visually striking elements that transform raw numbers into meaningful narratives.
Enhanced Decision-Making
Unlock the power of data exploration with interactive features designed to provide actionable insights for smarter decision-making.
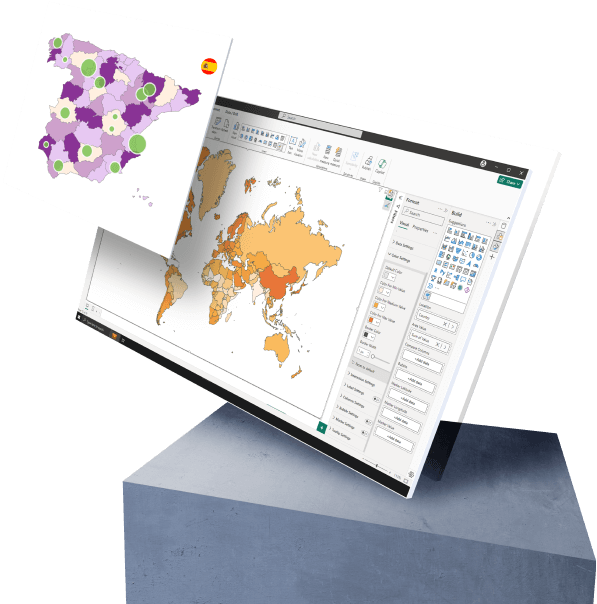
Seamless Integration
Designed to fit effortlessly into your Power BI environment, Map by Squillion offers customizable options and a professional design that enhances both functionality and style.
Faster Response Time
Experience a smooth and efficient user interface with optimized performance for real-time analysis.
Regular Updates
Benefit from consistent updates that improve performance, introduce cutting-edge features, and ensure compatibility with the latest Power BI advancements.
Visual Plans

Plan | Monthly Price | Annual Price |
---|---|---|
Map by Squillion (1-10 Users) | First month free, then $1.00/user/month |
First month free, then $10.00/user/year |
Map by Squillion (11-150 Users) | First month free, then $0.50/user/month |
First month free, then $5.00/user/year |
Map by Squillion (151-1000 Users) | First month free, then $0.10/user/month |
First month free, then $1.00/user/year |
Map by Squillion (1001-2500 Users) | First month free, then $0.05/user/month |
First month free, then $0.50/user/year |
Map by Squillion (>2500 Users) | First month free, then $0.04/user/month |
First month free, then $0.40/user/year |
Custom pricing available for enterprises with specific needs. Contact us for details.
Get started with map by squillion today!
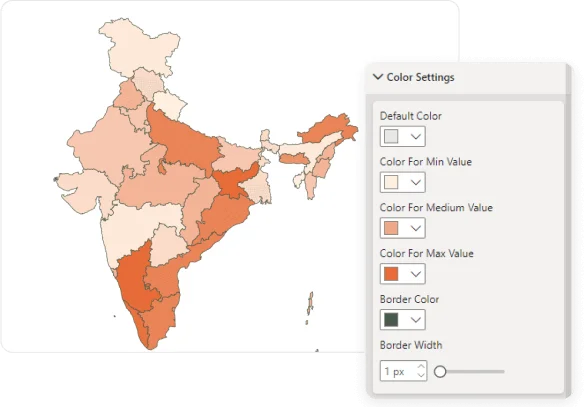
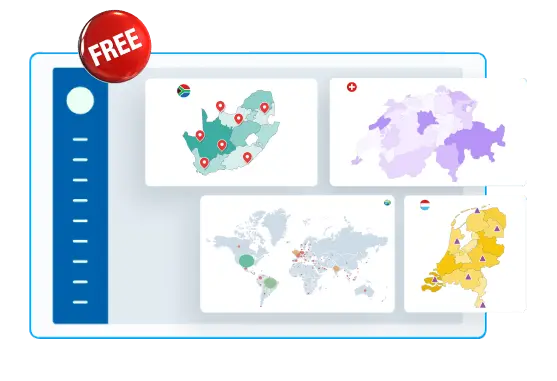
Add and Explore Map by Squillion’s set of features. Make your report visually rich.- Choropleth Coloring
- Area Bubbles
- Location Markers
- Area Labels
- Dynamic Interaction
Premium Features for an Enhanced Experience!
Unlock the full potential of your data visualizations with the Premium version of Map by Squillion. Elevate your reports, captivate your audience, and unlock new insights that drive success.- Watermark Removal
- Custom Location Markers
- Comparison Columns
FAQs
Will purchasing one of the plans remove the watermark?
Yes, purchasing any of the plans will remove the watermark.
Does your visual require separate licensing for each viewer?
Yes, there will be separate licensing per user. If you have a greater number of viewers, we recommend you select a plan according to your user base. We also support enterprises, so feel free to contact us directly for a custom quote.
I can use all the features in desktop version while report development but as soon as I publish it asks for license. Is your visual fully licensed?
No, only a few features require a license. So, if you are using any of those features, the visual will ask for a license. Here’s the list of features you unlock with a license:
1. Comparison Columns
2. Custom Location Markers
3. Watermark
How to use custom location marker?
The location marker is SVG supported. So, you can copy the SVG code and paste it directly into the Custom Icon SVG text field in the marker’s formatting settings.
What are the different location types supported in Map by Squillion?
For now our visual supports only County and State data as location. The states could be entered in following ways:
1. State/Province Name (Example: For France, “Grand Est”).
2. State/Province Short Name (Example: For France, “GE”).
3. State/Province Short Name with country name (Example: For France, “FR-GES”).
If the map displays gray (default) color, it is possible that the name for that visual does not match with the name in the maps code. So, we recommend using the names that our map supports. You can find the whole list of names supported by our visual here:
Does you map has zoom functionality?
Yes, our map has zoom functionality. You can find it under Interactivity settings.
How do I enable location marker clustering?
There is a whole separate option to be enabled for location marker clustering. If you are not able to find it, you need to enable the Map Zoom from interactivity settings and the Marker Cluster Options.
Can I have different location markers on a single map?
Yes. By adding a category column in the Marker Category field, you can unlock the options to have different location markers on a single map.